
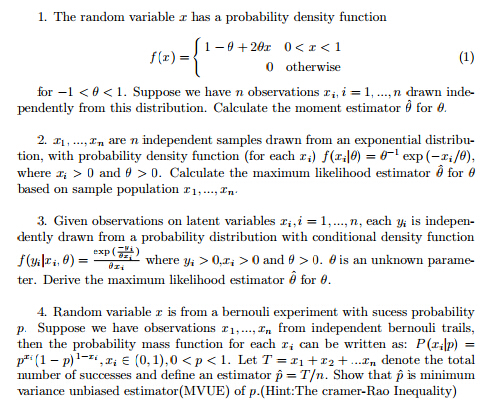
1. The random variable x has a probability density
function
f(x) =
(
1 ?? + 2x 0 < x < 1
0 otherwise
(1)
for ??1 < < 1. Suppose we have n observations xi; i = 1; :::;
n drawn inde-
pendently from this distribution. Calculate the moment estimator ^
for .
2. x1; :::; xn are n independent samples drawn from an exponential
distribu-
tion, with probability density function (for each xi) f(xij) = ??1
exp (??xi=),
where xi > 0 and > 0. Calculate the maximum likelihood
estimator ^ for
based on sample population x1; :::; xn.
3. Given observations on latent variables xi; i = 1; :::; n, each
yi is indepen-
dently drawn from a probability distribution with conditional
density function
f(yijxi; ) =
exp (
??yi
xi
)
xi
where yi > 0,xi > 0 and > 0. is an unknown parame-
ter. Derive the maximum likelihood estimator ^ for .
4. Random variable x is from a bernouli experiment with sucess
probability
p. Suppose we have observations x1; :::; xn from independent
bernouli trails,
then the probability mass function for each xi can be written as:
P(xijp) =
pxi(1 ?? p)1??xi ; xi 2 (0; 1); 0 < p < 1. Let T = x1 + x2 +
:::xn denote the total
number of successes and de ne an estimator ^p = T=n. Show that ^p
is minimum
variance unbiased estimator(MVUE) of p.(Hint:The cramer-Rao
Inequality)
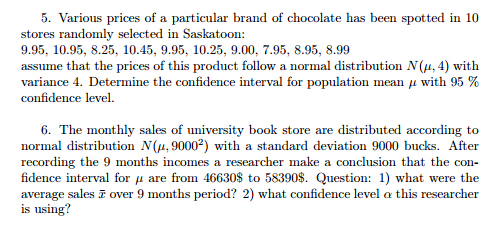
5. Various prices of a particular brand of chocolate has been
spotted in 10
stores randomly selected in Saskatoon:
9.95, 10.95, 8.25, 10.45, 9.95, 10.25, 9.00, 7.95, 8.95, 8.99
assume that the prices of this product follow a normal distribution
N(; 4) with
variance 4. Determine the con dence interval for population mean
with 95 %
con dence level.
6. The monthly sales of university book store are distributed
according to
normal distribution N(; 90002) with a standard deviation 9000
bucks. After
recording the 9 months incomes a researcher make a conclusion that
the con-
dence interval for are from 46630$ to 58390$. Question: 1) what
were the
average sales x over 9 months period? 2) what con dence level this
researcher
is using?
7. The quantity of hemoglobin in the blood stream of a man
follows a normal
distribution N(; 2). Suppose we collect 12 man’s homoglobin level
and nd
sample mean x = 13 g/dl and sample variance s2 = 4. Calculate 95%
con dence
interval for .

see more
ScholarMatic: Explanation & Answer
Your ready answer from a verified tutor is just a click away for as little as $14.99


Click Order Now to get 100% Original Answer Customized to your instructions!



