
The
data set has information on prices that houses sold for in five
different towns. We want to test the null hypothesis that
the
mean prices are equal in the five towns.
Part (a)
Carry
out a one-way ANOVA using Excel and include your output (the sheet that shows the result from carrying out
the ANOVA).
Part
(b)
Do
you reject the null hypothesis or not? Explain on what part of the
Excel output you base that decision.
Part (c)
Assuming
that an acquaintance of yours has never heard of ANOVA, explain to
him what the outcome in part (b) means in non-statistical terms.
Question
2
Suppose that we are testing whether
four population means are equal to each other. Further suppose that
instead
of doing ANOVA, we carry out separate hypothesis tests in which we
compare the four means to each other, two at a time. Using a level
of significance
of
? = 0.02, what is the probability of a Type I error in one or more
of the pair-wise hypothesis tests?
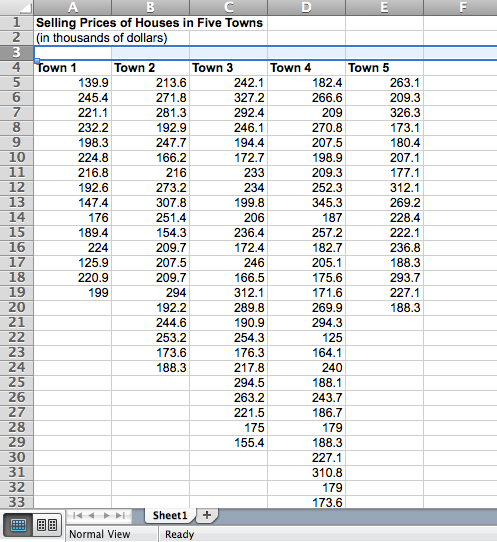
Show transcribed image text Selling Prices of Houses in Five Towns (in thousands of dollars)
Selling Prices of Houses in Five Towns (in thousands of dollars)
ScholarMatic: Explanation & Answer
Your ready answer from a verified tutor is just a click away for as little as $14.99


Click Order Now to get 100% Original Answer Customized to your instructions!