
Answer must include how to plot graphs and answers to (a)
through (e)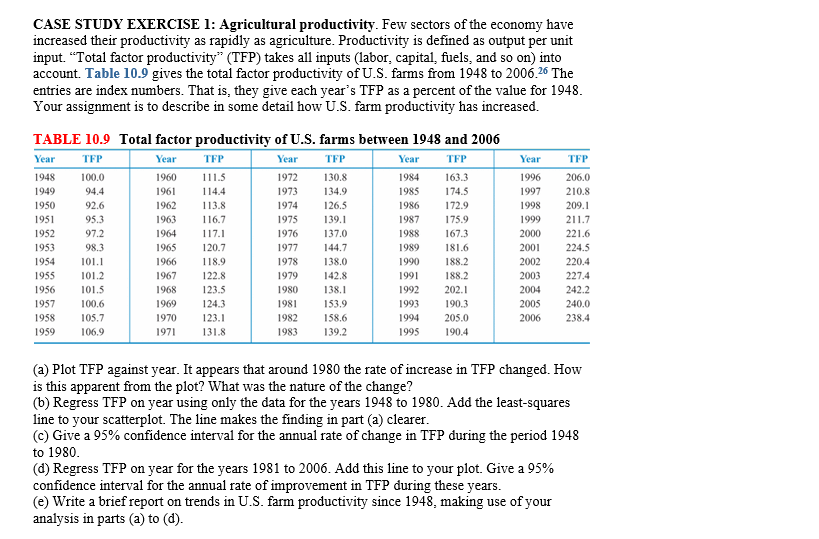
Show transcribed image text CASE STUDY EXERCISE 1: Agricultural productivity. Few sectors of the economy have increased their productivity as rapidly as agriculture. Productivity is defined as output per unit input. ''Total factor productivity'' (TFP) takes all inputs (labor, capital, fuels, and so on) into account. Table 10.9 gives the total factor productivity of U.S. farms from 1948 to 2006. The entries are index numbers. That is, they give each year's TFP as a percent of the value for 1948. Your assignment is to describe in some detail how U.S. farm productivity has increased. TABLE 10.9 Total factor productivity of U.S. farms between 1948 and 2006 (a) Plot TFP against year. It appears that around 1980 the rate of increase in TFP changed. How is this apparent from the plot? What was the nature of the change? (b) Regress TFP on year using only the data for the years 1948 to 1980. Add the least-squares line to your scatterplot. The line makes the finding in part (a) clearer. (c) Give a 95% confidence interval for the annual rate of change in TFP during the period 1948 to 1980. (d) Regress TFP on year for the years 1981 to 2006. Add this line to your plot. Give a 95% confidence interval for the annual rate of improvement in TFP during these years. (e) Write a brief report on trends in U.S. farm productivity since 1948, making use of your analysis in parts (a) to (d).
CASE STUDY EXERCISE 1: Agricultural productivity. Few sectors of the economy have increased their productivity as rapidly as agriculture. Productivity is defined as output per unit input. ''Total factor productivity'' (TFP) takes all inputs (labor, capital, fuels, and so on) into account. Table 10.9 gives the total factor productivity of U.S. farms from 1948 to 2006. The entries are index numbers. That is, they give each year's TFP as a percent of the value for 1948. Your assignment is to describe in some detail how U.S. farm productivity has increased. TABLE 10.9 Total factor productivity of U.S. farms between 1948 and 2006 (a) Plot TFP against year. It appears that around 1980 the rate of increase in TFP changed. How is this apparent from the plot? What was the nature of the change? (b) Regress TFP on year using only the data for the years 1948 to 1980. Add the least-squares line to your scatterplot. The line makes the finding in part (a) clearer. (c) Give a 95% confidence interval for the annual rate of change in TFP during the period 1948 to 1980. (d) Regress TFP on year for the years 1981 to 2006. Add this line to your plot. Give a 95% confidence interval for the annual rate of improvement in TFP during these years. (e) Write a brief report on trends in U.S. farm productivity since 1948, making use of your analysis in parts (a) to (d).
ScholarMatic: Explanation & Answer
Your ready answer from a verified tutor is just a click away for as little as $14.99


Click Order Now to get 100% Original Answer Customized to your instructions!



