
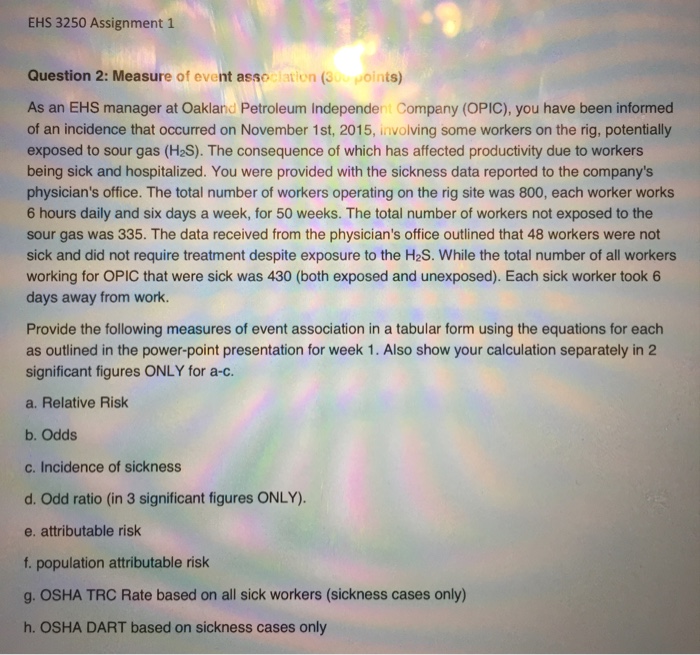
Show transcribed image text EHS 3250 Assignment 1 Question 2: Measure of event asso ation (3, ピoints) As an EHS manager at Oakland Petroleum Independent Company (OPIC), you have been informed of an incidence that occurred on November 1st, 2015, involving some workers on the rig, potentially exposed to sour gas (H2S). The consequence of which has affected productivity due to workers being sick and hospitalized. You were provided with the sickness data reported to the company's physician's office. The total number of workers operating on the rig site was 800, each worker works 6 hours daily and six days a week, for 50 weeks. The total number of workers not exposed to the sour gas was 335. The data received from the physician's office outlined that 48 workers were not sick and did not require treatment despite exposure to the H2S. While the total number of all workers working for OPIC that were sick was 430 (both exposed and unexposed). Each sick worker took 6 days away from work Provide the following measures of event association in a tabular form using the equations for each as outlined in the power-point presentation for week 1. Also show your calculation separately in 2 significant figures ONLY for a-c. a. Relative Risk b. Odds c. Incidence of sickness d. Odd ratio (in 3 significant figures ONLY) e. attributable risk f. population attributable risk g. OSHA TRC Rate based on all sick workers (sickness cases only) h, OSHA DART based on sickness cases only
EHS 3250 Assignment 1 Question 2: Measure of event asso ation (3, ピoints) As an EHS manager at Oakland Petroleum Independent Company (OPIC), you have been informed of an incidence that occurred on November 1st, 2015, involving some workers on the rig, potentially exposed to sour gas (H2S). The consequence of which has affected productivity due to workers being sick and hospitalized. You were provided with the sickness data reported to the company's physician's office. The total number of workers operating on the rig site was 800, each worker works 6 hours daily and six days a week, for 50 weeks. The total number of workers not exposed to the sour gas was 335. The data received from the physician's office outlined that 48 workers were not sick and did not require treatment despite exposure to the H2S. While the total number of all workers working for OPIC that were sick was 430 (both exposed and unexposed). Each sick worker took 6 days away from work Provide the following measures of event association in a tabular form using the equations for each as outlined in the power-point presentation for week 1. Also show your calculation separately in 2 significant figures ONLY for a-c. a. Relative Risk b. Odds c. Incidence of sickness d. Odd ratio (in 3 significant figures ONLY) e. attributable risk f. population attributable risk g. OSHA TRC Rate based on all sick workers (sickness cases only) h, OSHA DART based on sickness cases only
ScholarMatic: Explanation & Answer
Your ready answer from a verified tutor is just a click away for as little as $14.99


Click Order Now to get 100% Original Answer Customized to your instructions!



