
Note :I have the Answers however I need the details and
the steps to get that answer and not using excel all
manual
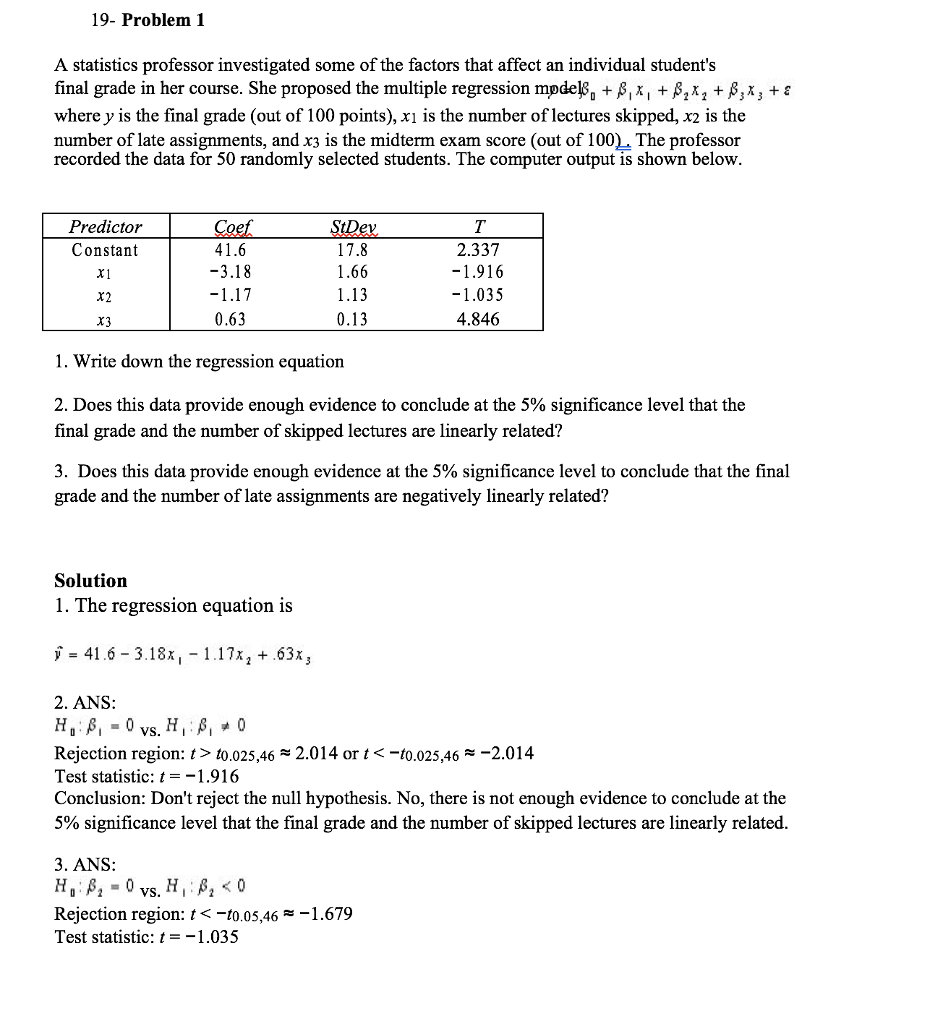
Show transcribed image text 19- Problem 1 A statistics professor investigated some of the factors that affect an individual student's final grade in her course. She proposed the multiple regression mpde, + β +D2x2 + β3χ3 +1 where y is the final grade (out of 100 points), xi is the number of lectures skipped, x2 is the number of late assignments, and x3 is the midterm exam score (out of 100) The professor recorded the data for 50 randomly selected students. The computer output is shown below Predictor Constant oe 41.6 -3.18 1.17 0.63 17.8 1.66 1.13 0.13 2.337 1.916 1.035 4.846 r2 x3 1. Write down the regression equation 2. Does this data provide enough evidence to conclude at the 5% significance level that the final grade and the number of skipped lectures are linearly related? 3. Does this data provide enough evidence at the 5% significance level to conclude that the final grade and the number of late assignments are negatively linearly related? Solution 1. The regression equation is y 41.6 3.18x 1.17x 63x 2. ANS: Rejection region: t > to·025,46-2.0 14 or K-t0.025,46–2014 Test statistic: t =-1.91 6 Conclusion: Don't reject the null hypothesis. No, there is not enough evidence to conclude at the 5% significance level that the final grade and the number of skipped lectures are linearly related 3. ANS: Rejection region:バブ0.05,46 ~-1 .679 Test statistic: 1.035
19- Problem 1 A statistics professor investigated some of the factors that affect an individual student's final grade in her course. She proposed the multiple regression mpde, + β +D2x2 + β3χ3 +1 where y is the final grade (out of 100 points), xi is the number of lectures skipped, x2 is the number of late assignments, and x3 is the midterm exam score (out of 100) The professor recorded the data for 50 randomly selected students. The computer output is shown below Predictor Constant oe 41.6 -3.18 1.17 0.63 17.8 1.66 1.13 0.13 2.337 1.916 1.035 4.846 r2 x3 1. Write down the regression equation 2. Does this data provide enough evidence to conclude at the 5% significance level that the final grade and the number of skipped lectures are linearly related? 3. Does this data provide enough evidence at the 5% significance level to conclude that the final grade and the number of late assignments are negatively linearly related? Solution 1. The regression equation is y 41.6 3.18x 1.17x 63x 2. ANS: Rejection region: t > to·025,46-2.0 14 or K-t0.025,46–2014 Test statistic: t =-1.91 6 Conclusion: Don't reject the null hypothesis. No, there is not enough evidence to conclude at the 5% significance level that the final grade and the number of skipped lectures are linearly related 3. ANS: Rejection region:バブ0.05,46 ~-1 .679 Test statistic: 1.035
ScholarMatic: Explanation & Answer
Your ready answer from a verified tutor is just a click away for as little as $14.99


Click Order Now to get 100% Original Answer Customized to your instructions!



