bw=brown
st=scarlet

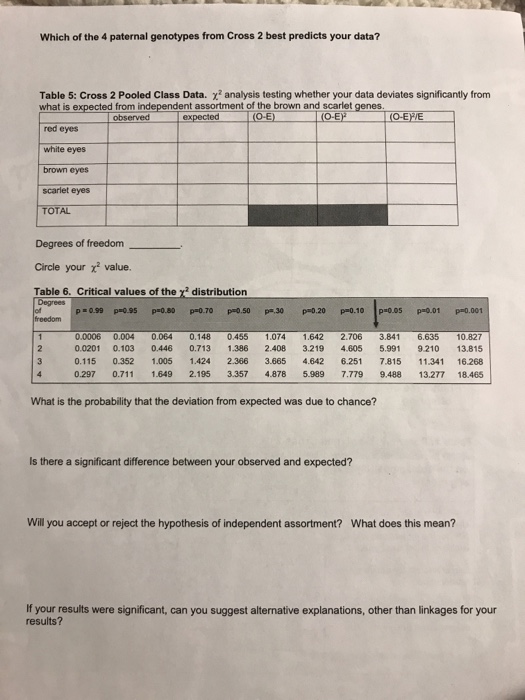
Which of the 4 paternal genotypes from Cross 2 best predicts your data? analysis testing whether your data deviates significantly from Table 5: Cross 2 Pooled Class Data. what is expected from ind t assortment of the brown and scarlet genes. observed expected (O-E) red eyes white eyes brown eyes scariet eyes TOTAL Degrees of freedom Circle your χ2 value. Table 6. Critical values of the y distribution p=0.99 p#0.95 p#0.80 pa0-70 .50 pa,30 .20 pm0.10 pm0.05 pag.01 p#0.001 freedom 0.0006 0.004 0.064 0.148 0.455 1.074 1.642 2.706 3.841 6.635 10.827 2 0.0201 0.103 0.446 0.713 1.386 2.408 3.219 4.605 5.991 9210 13.815 3 0.115 0.352 1.005 1.424 2.366 3.665 4.642 6.251 7.815 11.341 16.268 0.297 0.711 1.649 2.195 3.357 4.878 5.989 7.779 9.488 13.277 18.465 What is the probability that the deviation from expected was due to chance? Is there a significant difference between your observed and expected? Will you accept or reject the hypothesis of independent assortment? What does this mean? If your results were significant, can you suggest alternative explanations, other than linkages for your results?


